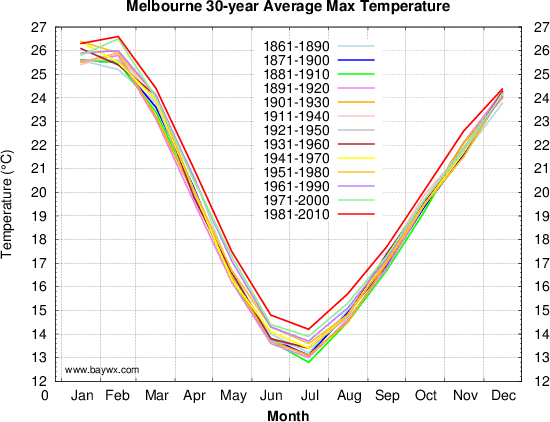
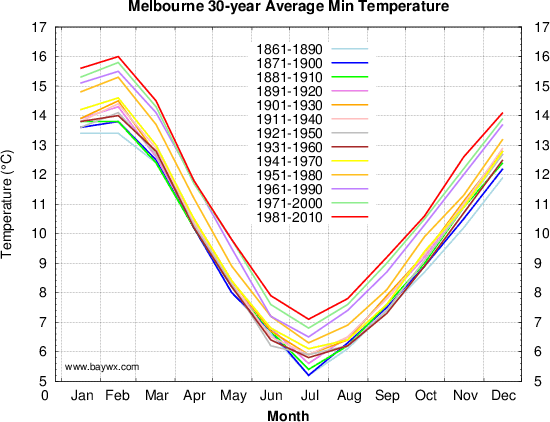
| Melbourne City 30-year Average Temperature |
|
|
|


|
| home | contact | |
|
Disclaimer:
Whilst all care is taken, users are advised to check the original source of all data before use. This page was originally hosted by the The University of Melbourne School of Earth Sciences. It uses publicly available weather data from the Bureau of Meteorology, marine data from CSIRO Marine and Atmospheric Research and tide data from the the Royal Yacht Club of Victoria |
)
)