| Melbourne City Average Air Temperature |
|
|
|
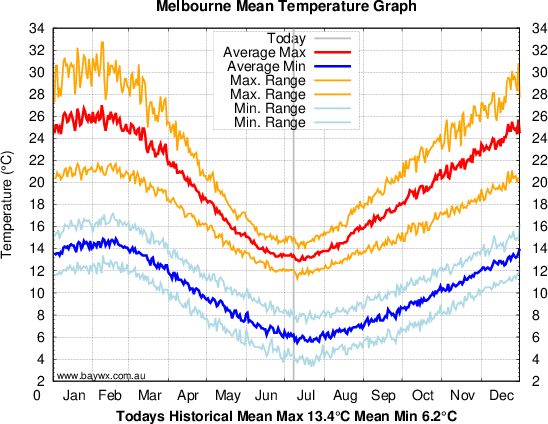
Coldest Day: 11 July (Av: 12.9, Median 12.9) Warmest Day: 7 February (Av: 27.0 Median: 25.4) The above graph shows the mean maximum and minimum temperature for each day, recorded at the official Melbourne observing site between May 1855 and August 2006 (approx. 152 years of record). The Max Range and Min Range are the values at the 25th and 75th percentiles for the historical Maximum and Minimum temperature obervations. In other words, half of all observations lie between these values. |
|
Melb. Climate | Melb. Daily Means | Daily Observations | Past 14 days |


|
| home | contact | |
|
Disclaimer:
Whilst all care is taken, users are advised to check the original source of all data before use. This page was originally hosted by the The University of Melbourne School of Earth Sciences. It uses publicly available weather data from the Bureau of Meteorology, marine data from CSIRO Marine and Atmospheric Research and tide data from the the Royal Yacht Club of Victoria |