Williamstown Tide and Waves - graph updated every 5 minutes


Williamstown Wave and Tide Graph
Significant Wave Height is approximately equal to the average crest-to-trough height of the highest
one-third of the waves. The maximum wave height can be up to twice the significant wave height.
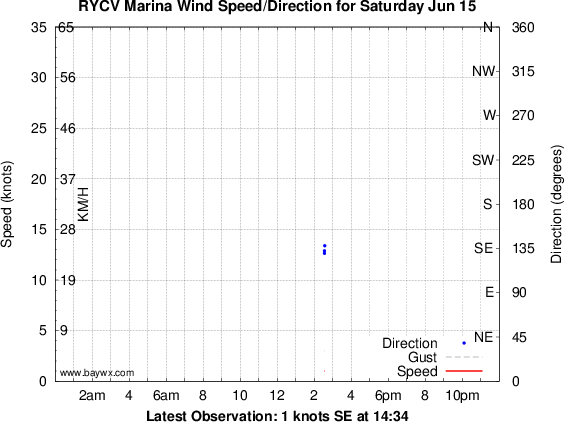
RYCV Wind Graph
Yesterdays Tide Graph   |   St Kilda Tide Graph   |   Weeks Tide Graph
Royal Yacht Club of Victoria   |   RYCV Web Cam   |   RYCV Weather Viewer
Williamstown sea level data   |   Port Phillip Tide Predictions   |   Tides Explained
Australian Tide Predictions   |   Sea Level Anomaly Forecast

Creative Commons Licence   QR Code   Baywinds facebook site | home | contact |

Disclaimer: This page, its content and style, are the responsibility of the author and do not represent the views, policies or opinions of the The University of Melbourne. Whilst all care is taken, users are advised to check the original source of all data before use.