|
|
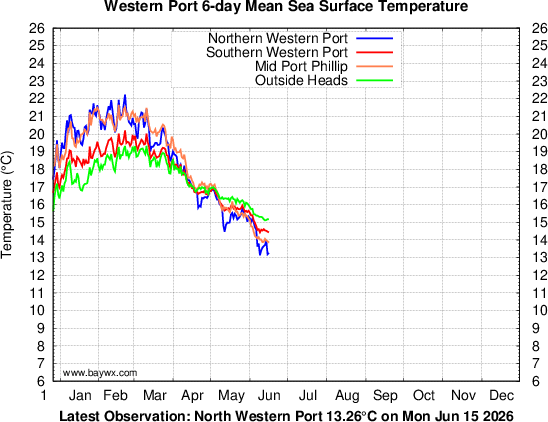
Port Phillip Graph Multi-year Comparison: Western Port/ Port Phillip /Bass Strait | Wave Buoy Temps 2001 | 2002 | 2003 | 2004 | 2005 | 2006 | 2007 | 2008 | 2009 | 2010 | 2011 | 2012 | 2013 2014 | 2015 | 2016 | 2017 | 2018 | 2019 | 2020 | 2021 | 2022 | 2023 | 2024 | 2025 North Point = Latitude: 38.26S, Longitude: 145.38E | South Point = Latitude: 38.45S, Longitude : 145.11E Observations are updated daily at 0:00 UTC. Graph redrawn at 11:30 EST. *N.B. Data taken from new system July 17 2002 |
)
)
)
)
)
)
)
)
)
)
)
)
)
)
)
)
)
)
)
)
)
)
)


|
| home | contact | |
| Disclaimer: This page, its content and style, are the responsibility of the author and do not represent the views, policies or opinions of the The University of Melbourne. Whilst all care is taken, users are advised to check the original source of all data before use. |