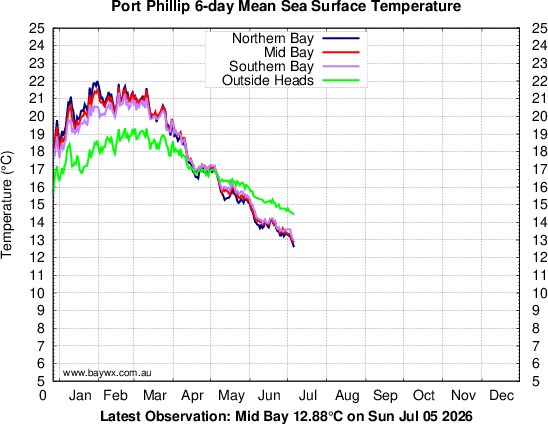
 Top Bay: 12.60℃ | Mid Bay: 12.88℃ | Bottom Bay: 12.96℃ | Ocean: 14.44℃ Feeling Generous? Buy me a Coffee! Satellite derived Ocean Data (April 2024 onwards) from NOAA Satellite derived Ocean Data previously from Copernicus | Bay | WestPort |
|
2000 | 2001 | 2002 | 2003 | 2004 | 2005 | 2006 | 2007 | 2008 | 2009 | 2010 | 2011 | 2012 | 2013 2014 | 2015 | 2016 | 2017 | 2018 | 2019 | 2020 | 2021 | 2022 | 2023 | 2024 | 2025 Multi-year Comparison:Bay/Ocean/W.Port | Bay vs Ocean | Average Temps | Anomaly Graph Location Map | Navy Ocean maps | Sydney Temp | Wave Buoy Temps | Sandy Point Temp North Point = Latitude: 38.0, Longitude: 144.9 | Mid Point = Latitude: 38.1, Longitude : 144.9 South Point = Latitude: 38.3, Longitude : 144.9 | Outside Bay = Latitude: 38.6, Longitude : 144.9 Observations are updated daily at 0:00 UTC. Graph redrawn at 11:30 EST. *N.B. Data taken from new system July 17 2002 |
)
)
)
)
)
)


|
| home | contact | |
|
Disclaimer:
Whilst all care is taken, users are advised to check the original source of all data before use. This page was originally hosted by the The University of Melbourne School of Earth Sciences. It uses publicly available weather data from the Bureau of Meteorology, marine data from CSIRO Marine and Atmopsheric Research and tide data from the the Royal Yacht Club of Victoria |